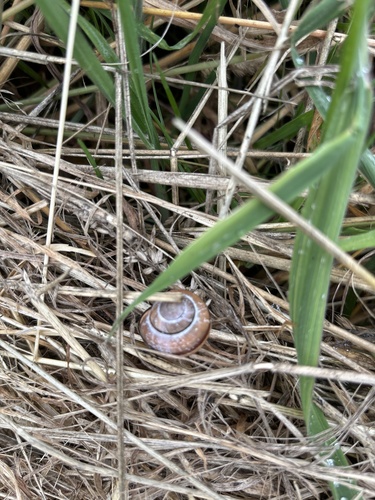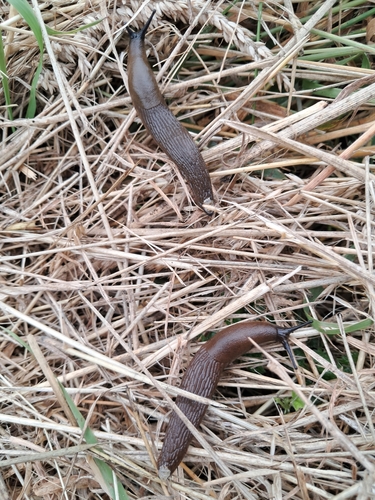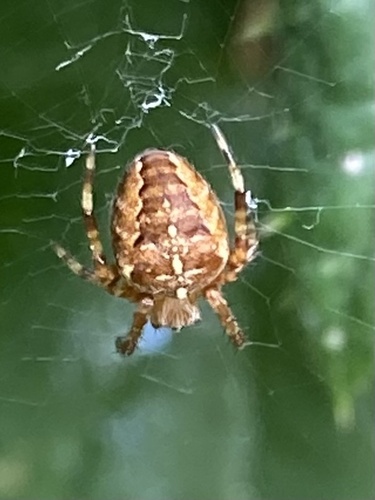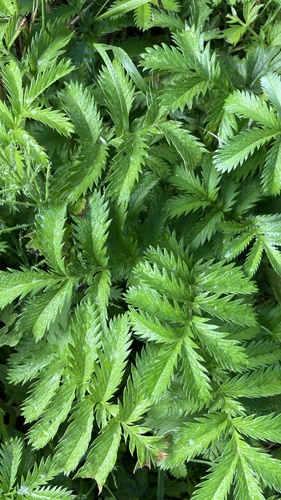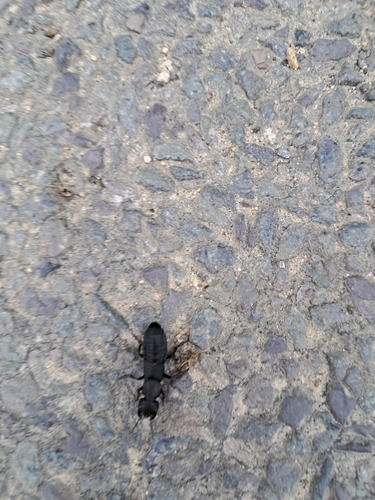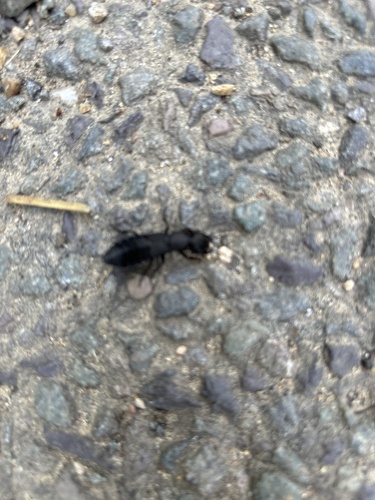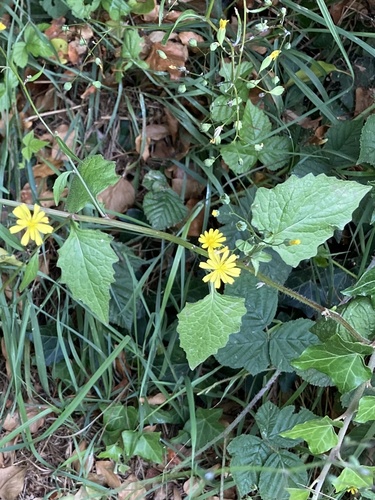
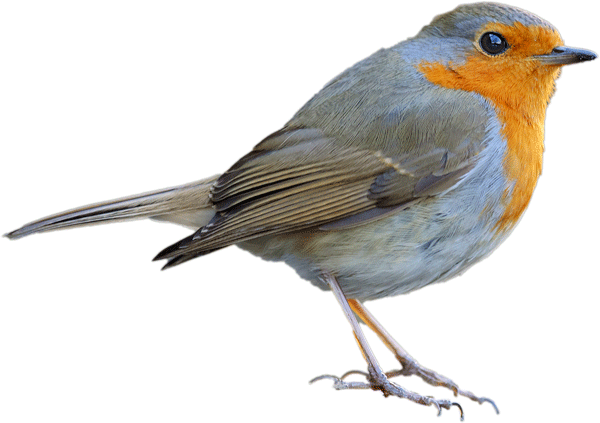
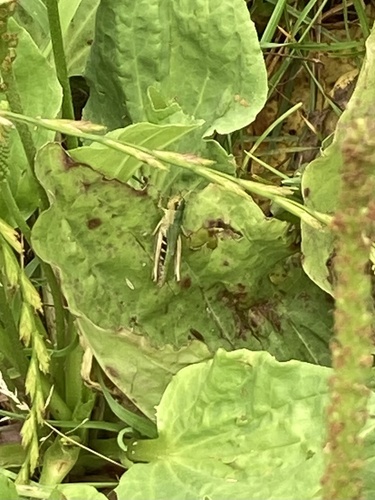
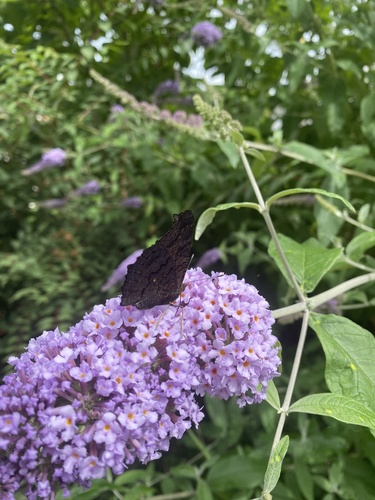
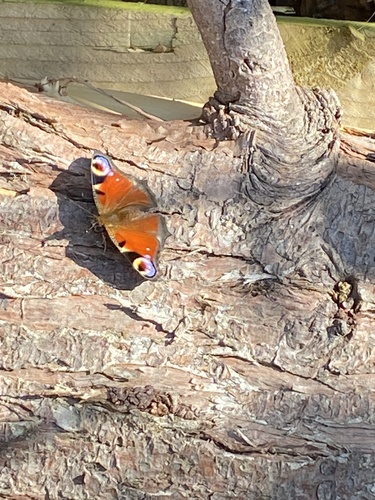
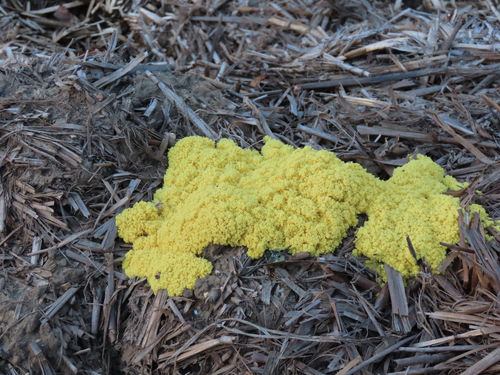
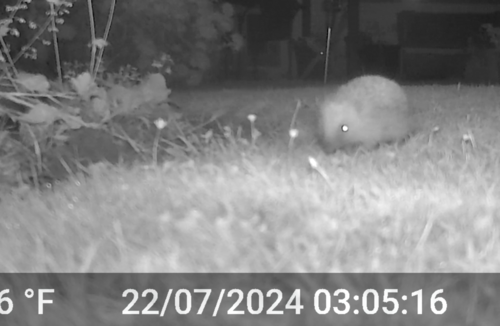
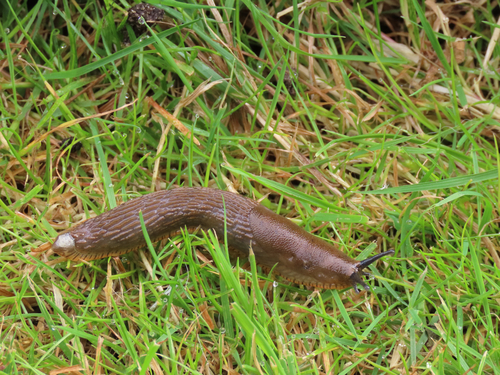
Most recent observations - hover to expand image
Many thanks to all those who have been involved with iNaturalist over the past year. Because of you we have gathered an awful lot of observations, and made some really amazing finds. As of July 2024, our totals are:


The next section shows some graphs and charts that outline some of the features of the observations.
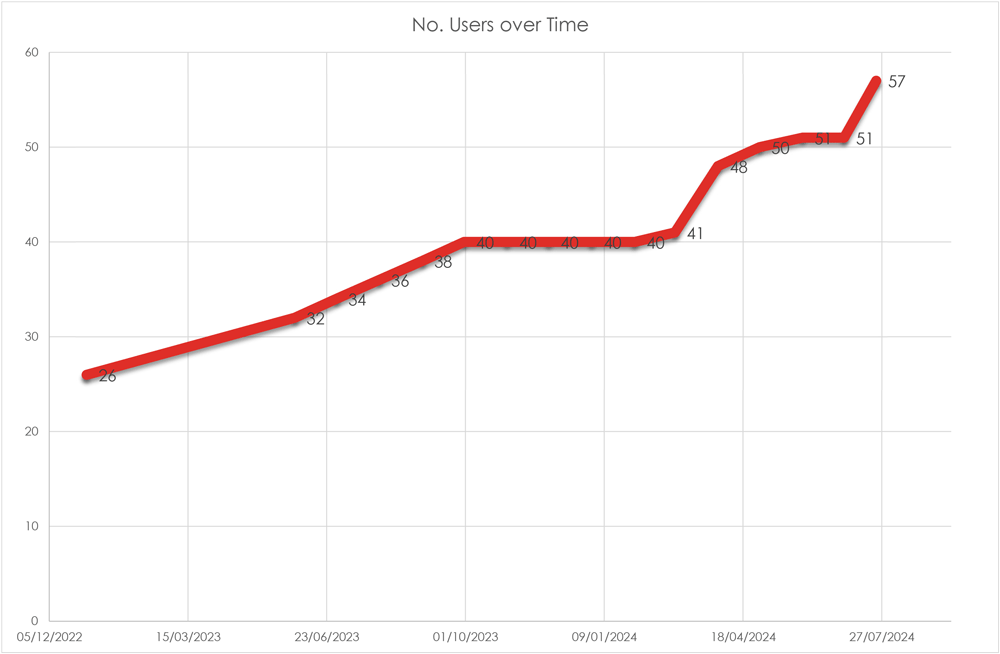
The graph belows show how the number of observers has increased over time. Before the project started 26 people had made iNaturalist observations in
Appleton, but this started to go up when Green Apppleton started using the app. The number really started to increase after the talk for the village
in March 2024, and the project was publicised on this website, and seems to be still increasing. Great! Everyone is more than welcome to join in - the
more observations the merrier.
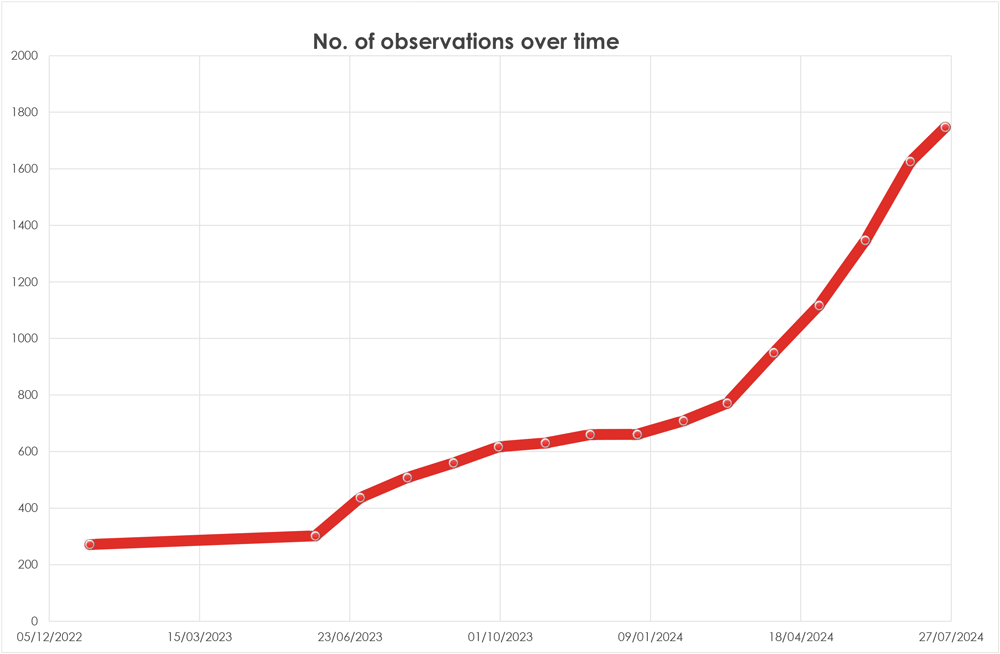
The graph of observations over time shows a similar story - not many being added to start with, then some activity once the Bioblitz
made people aware of what was going on. Not much happened over winter - people don't feel like going out observing, and there isn't much
life about. The come spring and the March talk the number of observations increases dramatically, and continues to increase through spring
and summer. Keep up the good work, chaps - we are starting to get a really good picture of the wildlife around us.
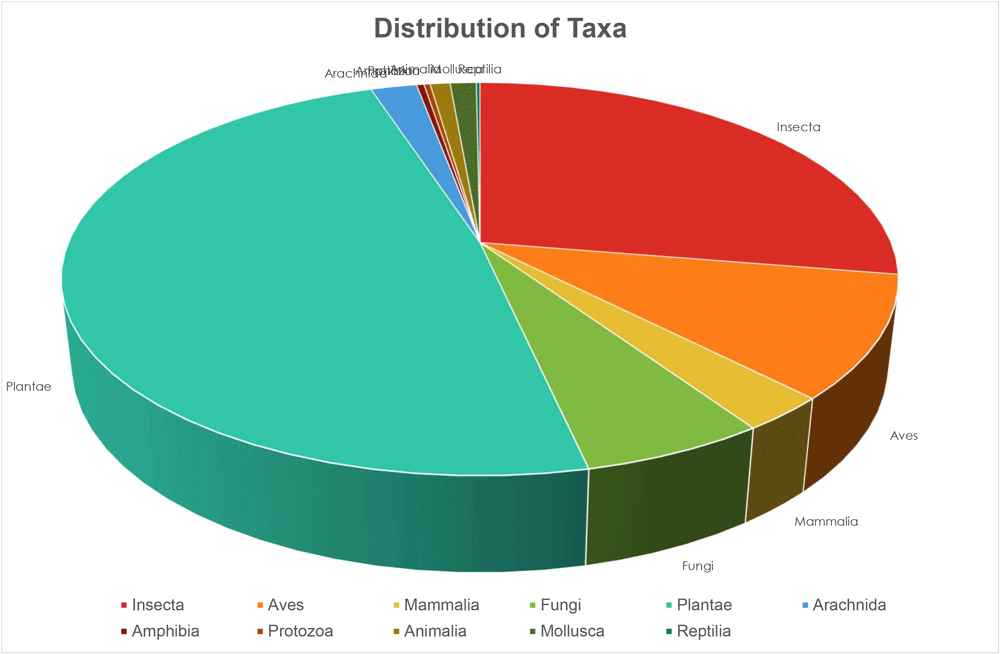
The pie chart shows what sort of wildlife has been observerd around Appleton. The group with the biggest slice of the pie is plants. This isn't surprising,
as they the easiest to observe and photograph as they can't run away. Insects are the next biggest group, but a significant number of birds and mammals have been
recorded, so we have some talented photographers out there, tracking down the more elusive creatures that live around us.
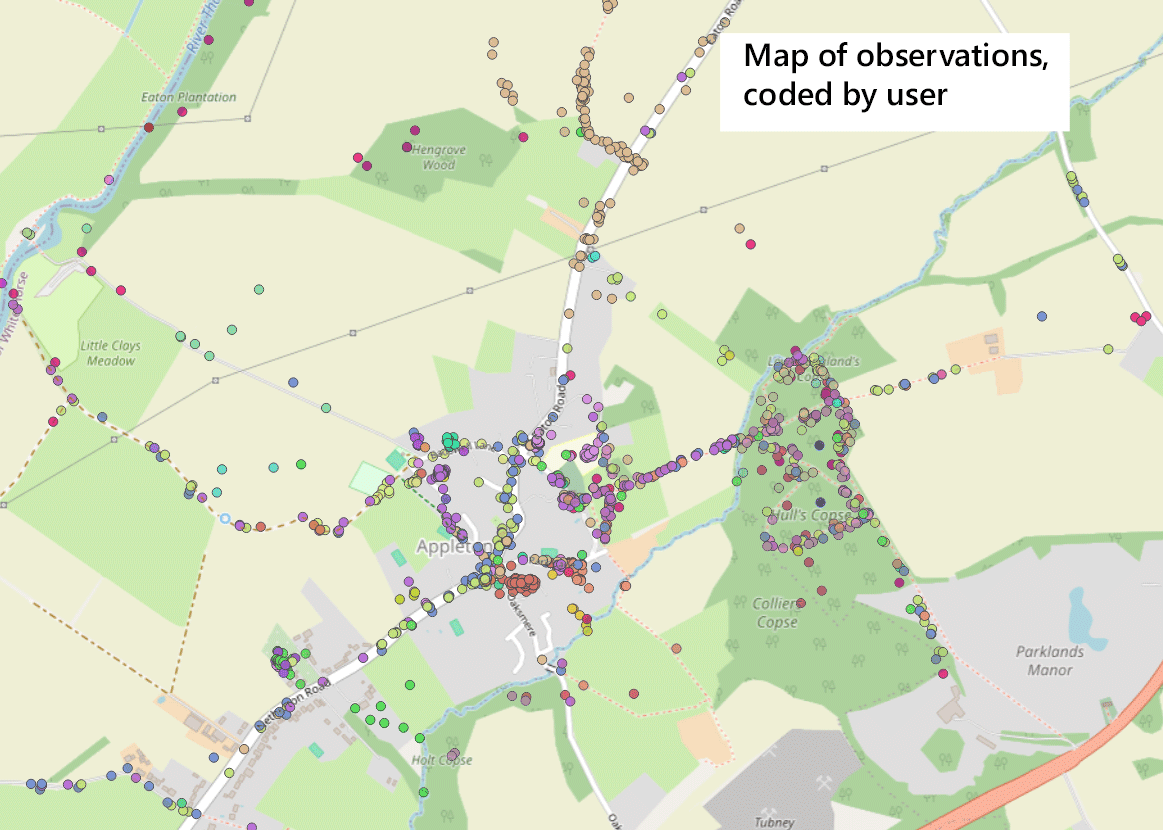
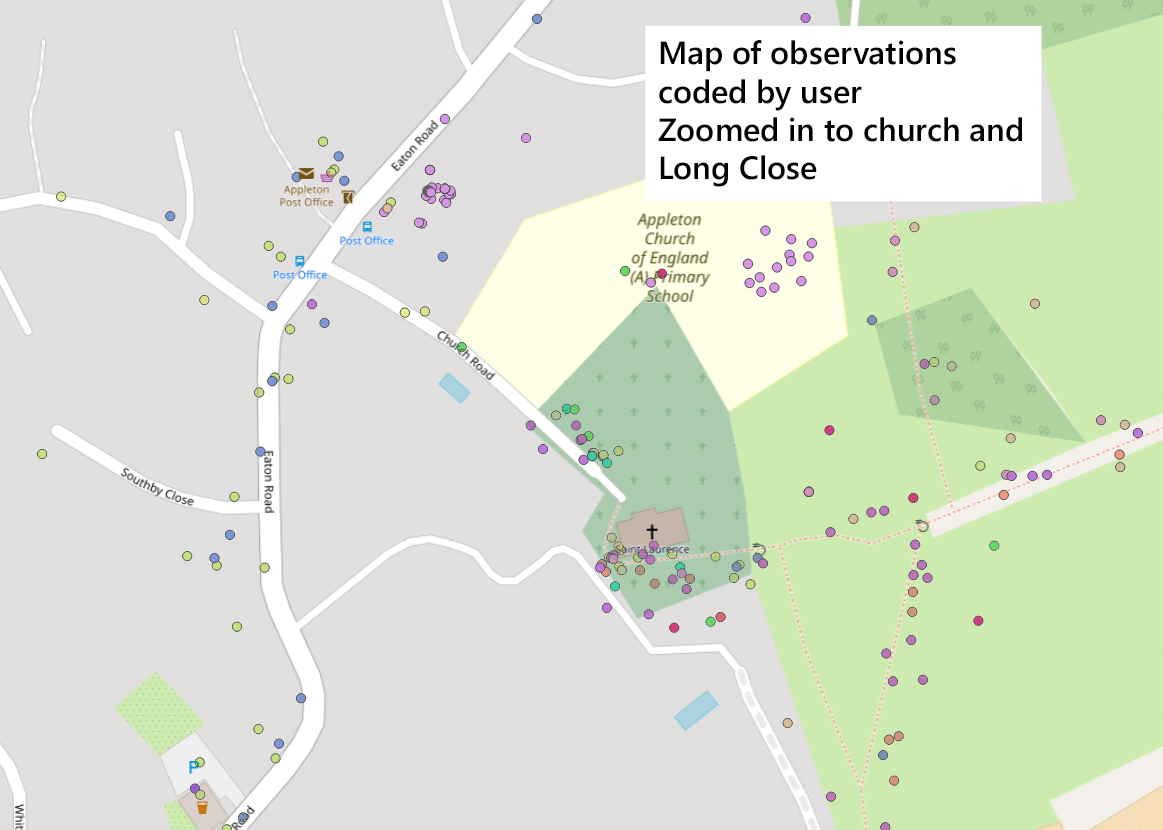
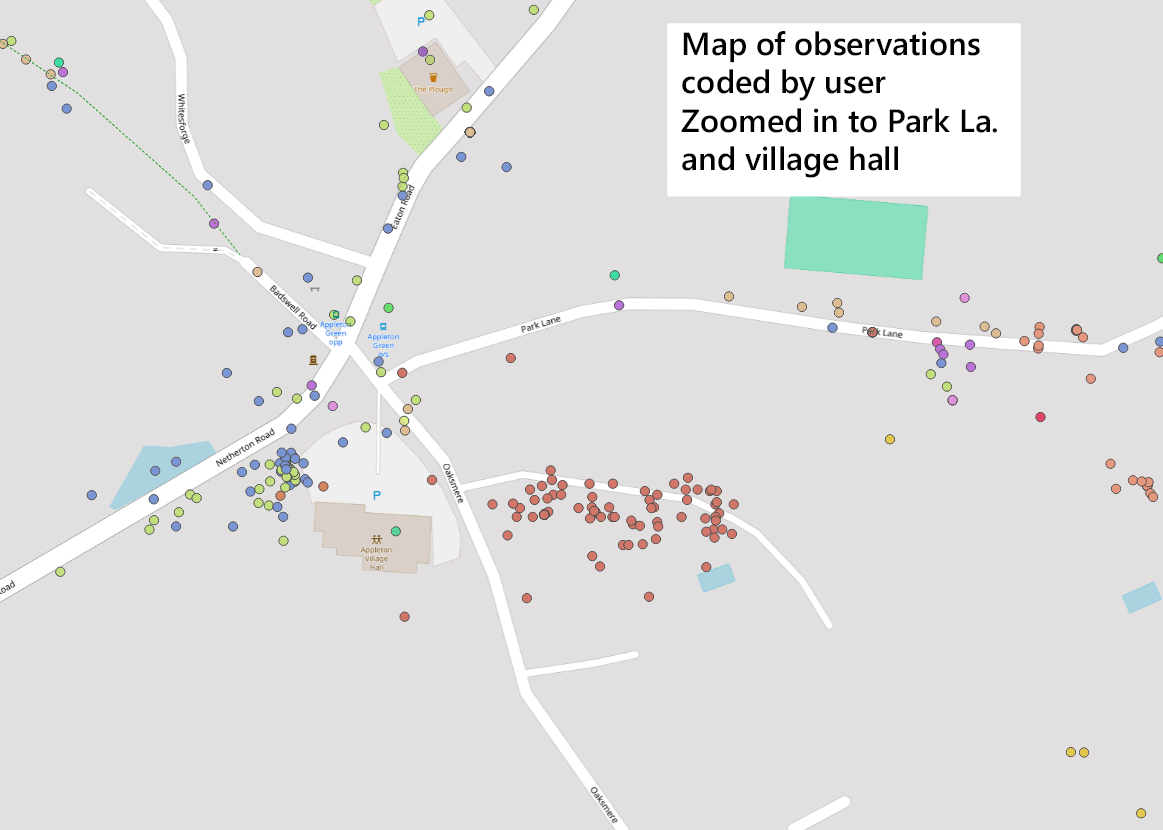
The map below shows where the observations have been made, around the parish. The different colours refer to different observers. The observations follow the various paths around the village and round the woods. There are an awful lot of points around the church and Long Close, and also around the village hall and Park Lane, so the next two maps are zoomed in to these two areas. Someone has been really busy around here!